
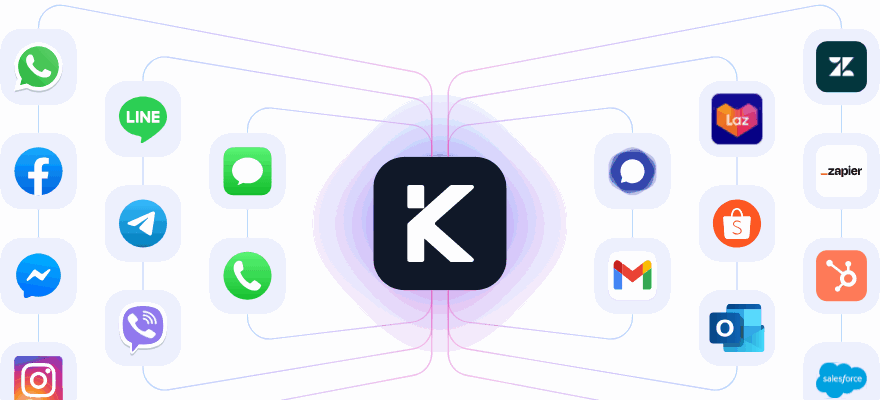
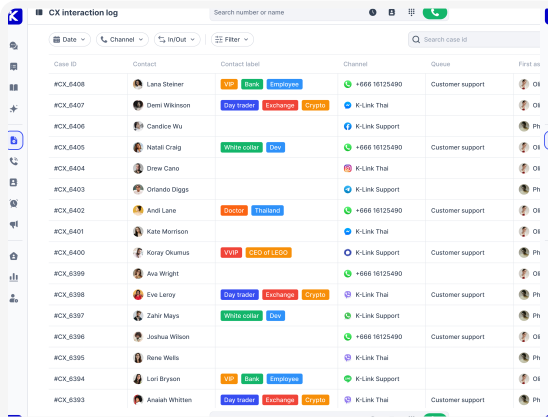
Every conversation on one timeline
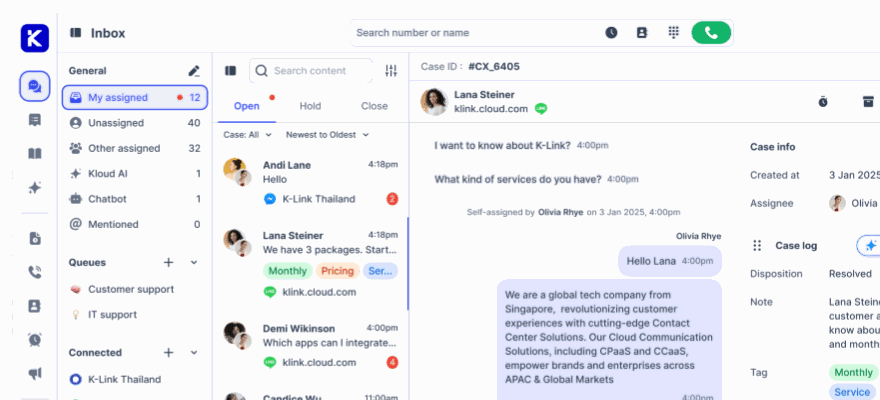
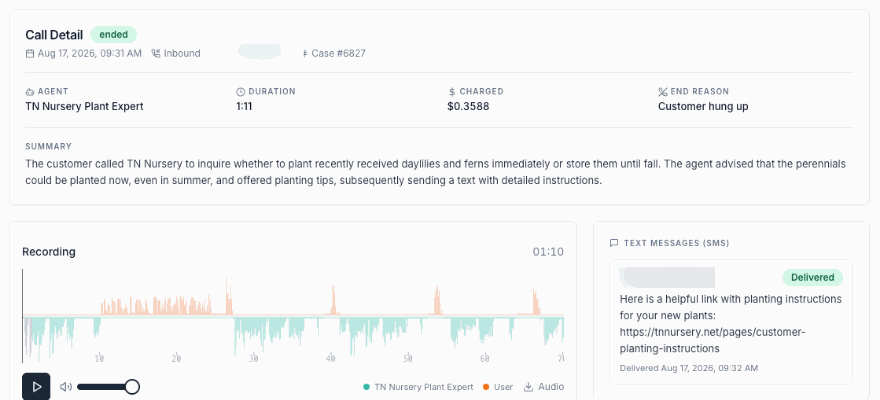
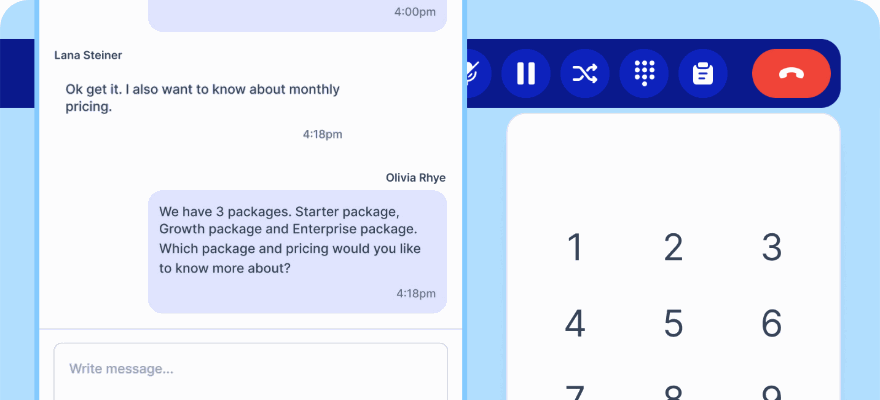
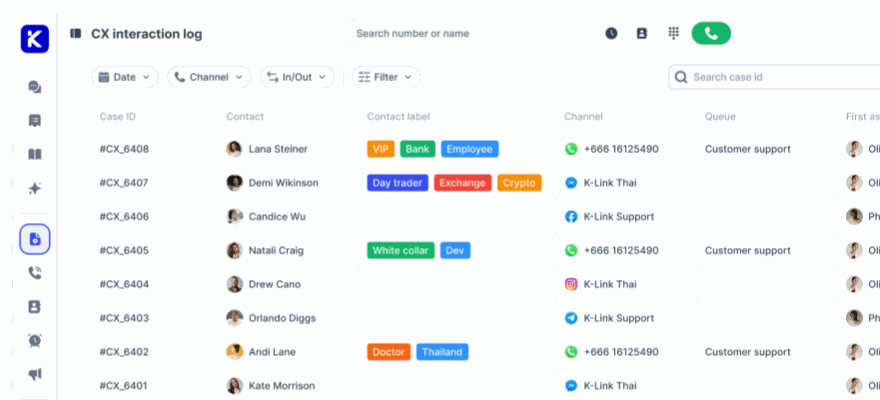
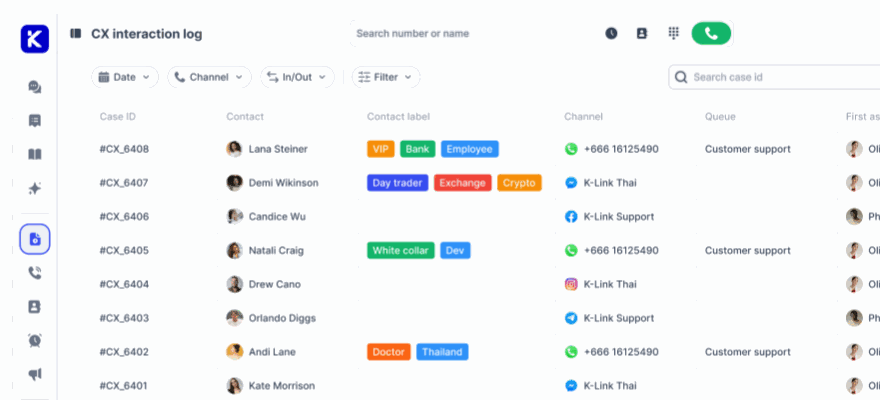
Calls, chats and tickets share one record, so response and resolution times are measured across the whole operation rather than per tool.
No credit card required.
Four tools, four sets of numbers
When voice reports in one system and messaging in another, nobody can say what a resolution actually costs, and the two never reconcile.
SLA you can see slipping
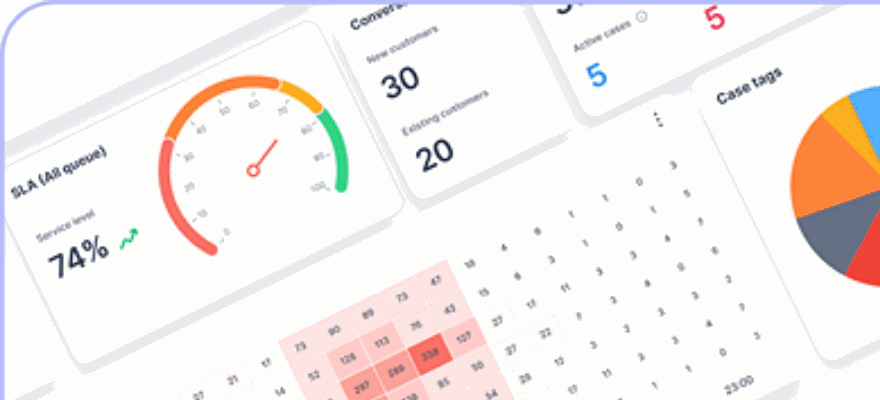
Queue SLA is shown as achieved against total, per queue and per channel, so a queue in trouble is visible before the week closes.
Response and resolution over time
First response time, resolution time and resolution rate move with the date range, so a change in staffing shows up as a change in the line.
Down to the individual agent
Open, hold and closed cases per agent with average response and resolution times, plus check in status, log in hours and daily activity.
The numbers your operation actually runs on
What is happening right now
Non queue, all queue and dedicated queue views, each with SLA, conversation activity and case status, filtered by date, queue and channel.
- Filter by queue, channel and date range
- New against existing customers
- Total, closed, assigned, unassigned and on hold
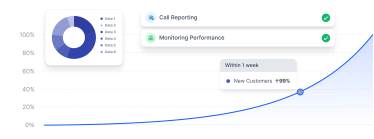
When the volume actually arrives
An hourly heatmap shows when messages land, and channel analytics shows where they come from, which is the pair of numbers that decides a shift roster.
- Hourly volume heatmap across the week
- Case counts and share by connected channel
- Case tags and dispositions with counts and percentages
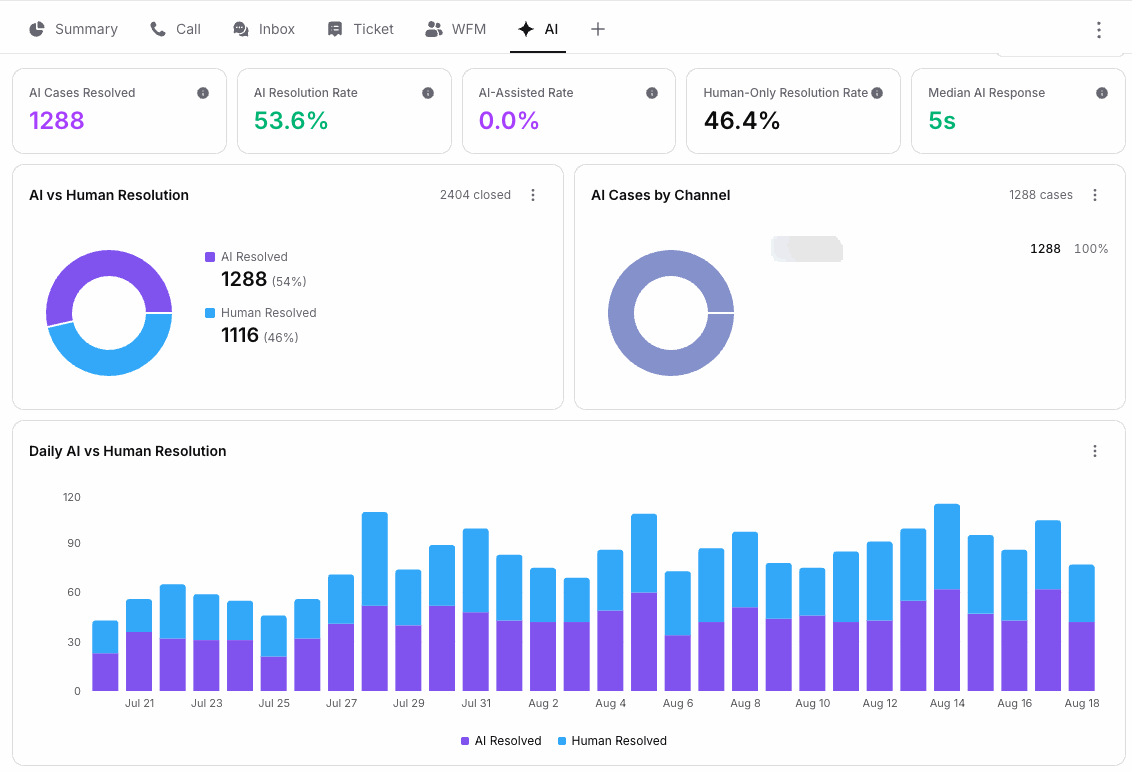
A tab for what the agent is doing
Summary, Call, Inbox, Ticket, workforce and AI sit as tabs on the same dashboard, so automation is measured in the same place as everything else rather than in a separate tool with its own definitions.
- AI cases resolved, resolution rate and assisted rate
- Human only resolution rate over the same period
- Median AI response time
- Closed cases split between agent and team, and by channel
See the rate move as the agent learns
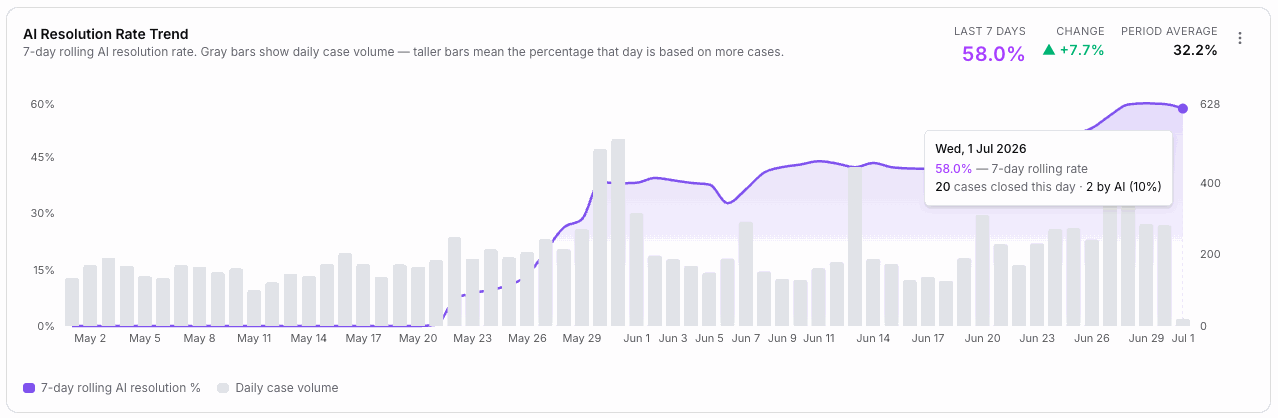
The rolling rate makes a rollout legible: the line climbs as knowledge and actions are added, with daily case volume behind it so the base is never hidden. This is the chart to look at before deciding whether automation is working.
- Seven day rolling rate rather than daily noise
- Daily volume behind the line
- Change against the previous period
- Per day detail on hover
Take it into your own reporting
Every table exports to CSV or XLSX with the filters applied, so finance and operations can work offline without asking for a screenshot.
- CSV or XLSX from any table
- Filters carried into the export
- Per agent and per queue detail included
The reports that come as standard
These are dashboards in the product rather than a data warehouse project.
Queue SLA
Achieved against total room count, shown per queue as a percentage.
First response time
Averaged and tracked across the selected range.
Resolution time
How long cases take to close, per queue and per agent.
Resolution rate
How much of the incoming volume actually gets closed.
Case status breakdown
Total, closed, assigned, unassigned and on hold.
Agent activity
Open, hold and closed counts with average response and resolution times.
Check in status
Log in and log out times, live status and total logged hours.
Volume heatmap
Hourly incoming message volume across the week.
Channel mix
Case counts and percentages for every connected channel.
Tags and dispositions
Counts and percentages, so a spike has a reason attached.
AI against human
AI resolution rate and AI assisted rate next to the same numbers for your team.
AI cases resolved
A count as well as a rate, so the volume behind the percentage is visible.
Human only resolution
The share your team closed without the agent, over the same period.
Median AI response
How fast the agent replies, in seconds.
AI cases by channel
Which channels the agent is closing cases on.
Rolling adoption trend
A seven day rolling rate over daily volume, which is how a rollout is judged.
Exports
CSV or XLSX from any table, with the filters you applied.
See your own numbers Connect a channel and the dashboards fill in as conversations arrive.
Stop reconciling four reports
Put voice and messaging on one timeline and measure the operation once.
No credit card required. Cancel anytime.